This widget displays a grid for a graph corresponding to the associated curve. It is typically used as a background for one or several CURVE_GRAPH objects.
See attributes common to all curve widgets.
Note that this element is deprecated and has been replaced by the more generic GRID element.
| Name | Value Type | Default Value | Description | Comment | V. |
|---|---|---|---|---|---|
|
color |
current text color |
Color of the grid lines. |
|
1.1 |
|
|
pen_style |
solid |
Style of the pen used to draw the grid lines. |
|
1.1 |
|
|
origin_color |
current text color |
Color of the origin lines of the grid. |
|
1.1 |
|
|
origin_pen_style |
solid |
Style of the pen used to draw the lines of the grid origin. |
|
1.1 |
|
|
subdiv_color |
'color' attribute value |
Color of the subdivision grid lines. |
|
1.1 |
|
|
subdiv_pen_style |
solid |
Style of the pen used to draw the grid subdivision lines. |
|
1.1 |
|
|
x_subdiv_count |
Positive Integer |
0 |
Number of subdivisions for the grid on the x axis |
Number of lines between the grid lines defined by x_positions_count |
1.1 |
|
y_subdiv_count |
Positive Integer |
0 |
Number of subdivisions for the grid on the y axis |
Number of lines between the grid lines defined by y_positions_count |
1.1 |
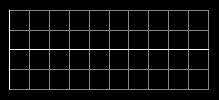
A simple grid with brighter color for origins:
<?xml version="1.0" encoding="utf-8" ?>
<SKIN language_version="1.0" background_color="#000000" v_margin="10" h_margin="10">
   <CURVE_GRID curve_id="dsp.output_curve3" y_positions_count="5" x_positions_count="11" color="#888888"
      width="200" height="80" origin_color="#ffffff" />
</SKIN>
Adding 1 vertical and horizontal subdivisions:
<?xml version="1.0" encoding="utf-8" ?>
<SKIN language_version="1.0" background_color="#000000" v_margin="10" h_margin="10">
   <CURVE_GRID curve_id="dsp.output_curve3" y_positions_count="5" x_positions_count="11" color="#888888"
      width="200" height="80" origin_color="#ffffff" />
</SKIN>

Here is an example to show how to use the grid with a single curve graph:
<?xml version="1.0" encoding="utf-8" ?>
<SKIN language_version="1.0" background_color="#000000" v_margin="10" h_margin="10">
   <CURVE_GRID curve_id="dsp.output_curve3" y_positions_count="5" x_positions_count="11" color="#888888"
      width="200" height="80" x_subdiv_count="1" y_subdiv_count="1" subdiv_color="#4444444" origin_color="#ffffff">
      <CURVE_GRAPH width="100%" height="100%" curve_id="dsp.output_curve3" color="#00ff00" />
   </CURVE_GRID>
</SKIN>
